PlotID - A framework for tracking figures
Demo Implementation of the Toolkit PlotID
Summary
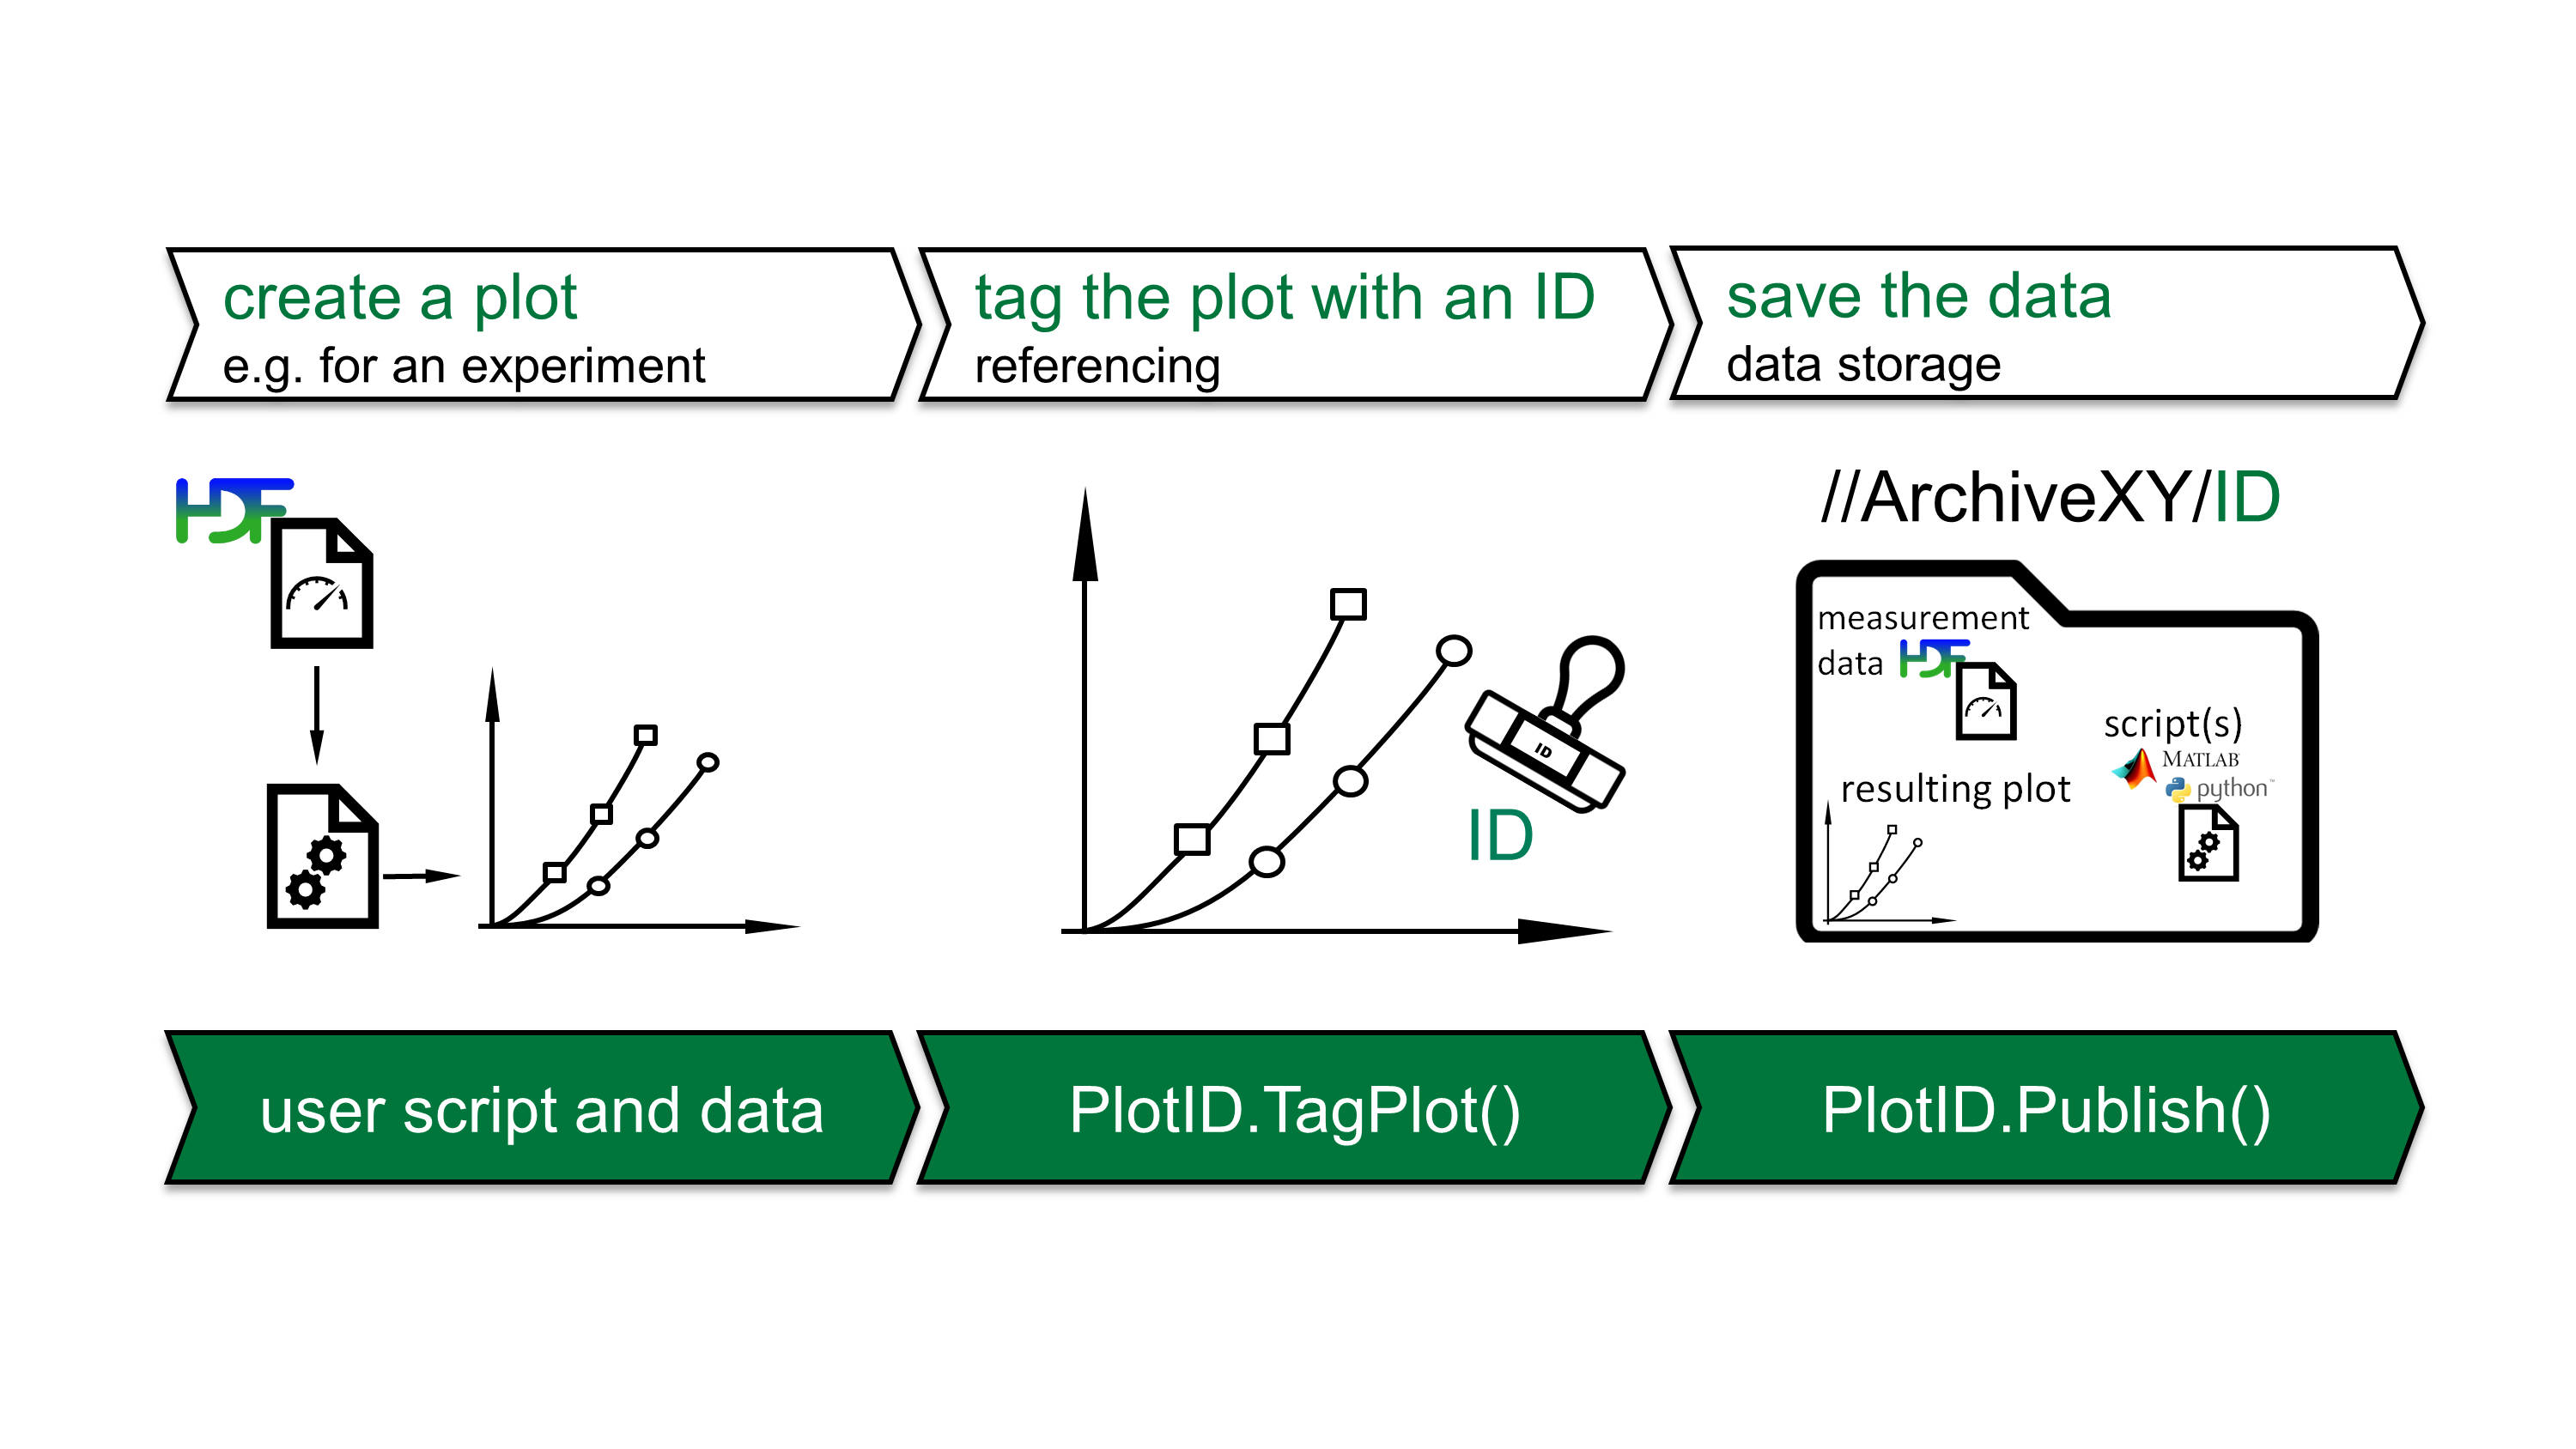
The plotID toolkit supports researchers in tracking and storing relevant data in plots. Plots are labeled with an ID and the corresponding data is stored depending on the researcher’s need.
The Software is Open Source and the repository is available at GitLab.
Measures: A-2-2, A-2-3, A-2-5, A-3-2
Description
Figure, plots and diagrams are key for presenting condensed knowledge in the scientific world. However, it is often difficult or impossible to understand which data are shown in an image or and how they were processed. PlotID helbs you in two steps. First the plot is labeled with an ID of your choise and second the research data and the plotting script is exported in a folder with this ID. This makes it possible to reproduce the workflow in future.
Status
planned activities
- Investigation about tools plotID could be integrated with (software workflows, JupyterLab Notebooks, data validation pipelines…)
in progress activities
- We are now working hard on MATLAB V2.0 with many additional Features
- Starting in Q2 a python version is developed
- Started in October 2021, the first pilot user made use of the toolkit and gave valuable feedback.
completed activities
- A stable release is published at Zenodo in Q1 2022
- Implementation in MATLAB, which fullfills the basic user needs. Q4 2021
Results
- a simple CI/CD test case implemented
- toolkit which makes referencing plots easy and enables the export of the research data
The release of PlotID V1 is available on GitLab, feel free to participate.
Lessons Learned/ Recommendations
- usability is crucial for user acceptance
- ease of use requires a lot of user feedback
- object oriented programming should be used, if a lot of communication between functions is neccesary
Publication(s)
For a detailed documentation, see the GitLab group of PlotID.
Acknowledgements
We acknowledge contributions from the NFDI4ing Team @TU Darmstadt and the pilot users.